API
Calculations
- manufacturing.suggest_specification_limits(data: list[int] | list[float] | Series | ndarray, sigma_level: float = 3.0)
Given a data set and a sigma level, returns a tuple of specification limits.
- Parameters:
data – the data to be analyzed
sigma_level – the sigma level; the default value is 3.0, but some users may prefer a higher sigma level for their process
- Returns:
a
tupleof(lower_specification_limit, upper_specification_limit)
- manufacturing.calc_ppk(data: list[int] | list[float] | Series | ndarray, upper_specification_limit: int | float | None = None, lower_specification_limit: int | float | None = None)
Calculate and return the Pp (upper and lower) of the provided dataset given the upper and/or lower specification limits.
- Parameters:
data – the data to be analyzed
upper_specification_limit – the upper specification limit
lower_specification_limit – the lower specification limit
- Returns:
the ppk level
- manufacturing.calc_pp(data: list[int] | list[float] | Series | ndarray, upper_specification_limit: int | float, lower_specification_limit: int | float)
Calculate and return the Pp of the provided dataset given the specification limits.
- Parameters:
data – the data to be analyzed
upper_specification_limit – the upper specification limit
lower_specification_limit – the lower specification limit
- Returns:
the pp level
Plotting & Charting
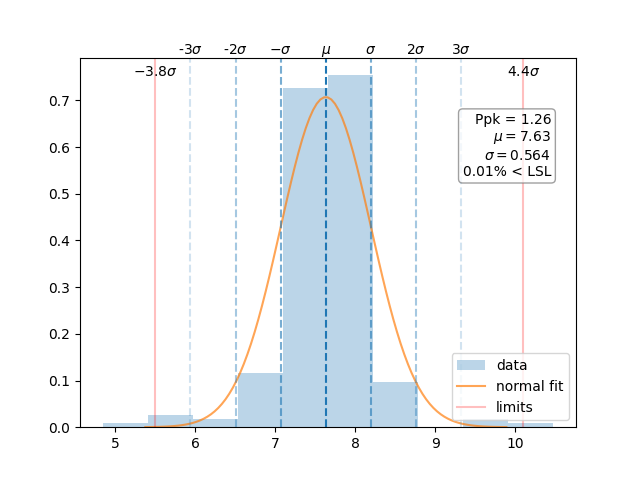
- manufacturing.ppk_plot(data: list[int] | list[float] | Series | ndarray, upper_specification_limit: int | float | None = None, lower_specification_limit: int | float | None = None, parameter_name: str | None = None, threshold_percent: float = 0.001, is_subset: bool = False, show_dppm: bool = False, figure: Figure | None = None)
Shows the statistical distribution of the data along with Ppk/Cpk and limits.
- Parameters:
data – a list, pandas.Series, or numpy.ndarray representing the data set
upper_specification_limit – an integer or float which represents the upper specification limit (USL)
lower_specification_limit – an integer or float which represents the lower specification limit (LSL)
parameter_name – a string that shows up in the title
threshold_percent – the threshold at which % of units above/below the number will display on the plot
is_subset – False if the data represents a complete dataset, else True; determines if Ppk or Cpk are in the titles
show_dppm – True if defective parts-per-million are to be shown
figure – an instance of
matplotlib.figure.Figure
- Returns:
an instance of
matplotlib.figure.Figure
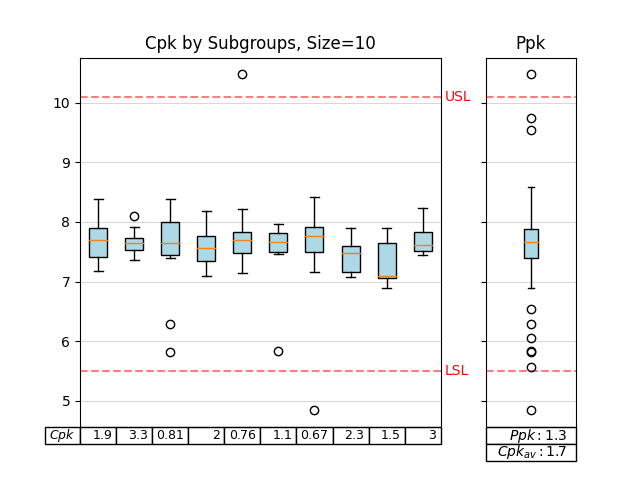
- manufacturing.cpk_plot(data: list[int] | list[float] | Series | ndarray, upper_specification_limit: int | float, lower_specification_limit: int | float, parameter_name: str | None = None, subgroup_size: int = 30, max_subgroups: int = 10, figure: Figure | None = None) Figure
Boxplot the Cpk in subgroups os size subgroup_size.
- Parameters:
data – a list, pandas.Series, or
numpy.ndarrayrepresenting the data setupper_specification_limit – an integer or float which represents the upper specification limit (USL)
lower_specification_limit – an integer or float which represents the lower specification limit (LSL)
parameter_name – the name of the parameter that will be displayed on the plot
subgroup_size – the number of samples to include in each subgroup
max_subgroups – the maximum number of subgroups to display
figure – an instance of
matplotlib.figure.Figure
- Returns:
an instance of
matplotlib.figure.Figure
- manufacturing.control_chart(data: list[int] | list[float] | Series | ndarray, parameter_name: str | None = None, x_upper_control_limit: float | int | None = None, x_lower_control_limit: float | int | None = None, r_upper_control_limit: float | int | None = None, r_lower_control_limit: float | int | None = None, highlight_beyond_limits: bool = True, highlight_zone_a: bool = True, highlight_zone_b: bool = True, highlight_zone_c: bool = True, highlight_trend: bool = True, highlight_mixture: bool = False, highlight_stratification: bool = False, highlight_overcontrol: bool = False, max_points: int | None = 60, figure: Figure | None = None) Figure
Automatically selects the most appropriate type of control chart, based on the number of samples supplied in the data and the
max_pointsand returns amatplotlib.figure.Figurecontaining the control chart(s).- Parameters:
data – (List[int], List[float], pd.Series, np.ndarray),
parameter_name – a string representing the parameter name
x_upper_control_limit – an optional parameter which, when present, will override the internally calculated upper control limit for the X plot; note that this is NOT the specification limit!
x_lower_control_limit – an optional parameter which, when present, will override the internally calculated lower control limit for the X plot; note that this is NOT the specification limit!
r_upper_control_limit – an optional parameter which, when present, will override the internally calculated upper control limit for the R/S plot; note that this is NOT the specification limit!
r_lower_control_limit – an optional parameter which, when present, will override the internally calculated lower control limitfor the R/S plot; note that this is NOT the specification limit!
highlight_beyond_limits – True if points beyond limits are to be highlighted
highlight_zone_a – True if points that are zone A violations are to be highlighted
highlight_zone_b – True if points that are zone B violations are to be highlighted
highlight_zone_c – True if points that are zone C violations are to be highlighted
highlight_trend – True if points that are trend violations are to be highlighted
highlight_mixture – True if points that are mixture violations are to be highlighted
highlight_stratification – True if points that are stratification violations are to be highlighted
highlight_overcontrol – True if points that are overcontrol violations are to be hightlighted
max_points – the maximum number of points to display (‘None’ to display all)
figure – an instance of
matplotlib.figure.Figure
- Returns:
an instance of
matplotlib.figure.Figure
- manufacturing.run_chart(data: list[int] | list[float] | Series | ndarray, parameter_name: str | None = None, upper_control_limit: float | int | None = None, lower_control_limit: float | int | None = None, highlight_beyond_limits=True, max_points: int | None = 60, figure: Figure | None = None) Figure
Create a pre-control chart based on the input data. Pre-control charts contain less information and are more suitable for direct usage by production personnel.
- Parameters:
data – a list, pandas.Series, or numpy.ndarray representing the data set
parameter_name – a string representing the parameter name
upper_control_limit – an optional parameter which, when present, will override the internally calculated upper control limit; note that this is NOT the specification limit!
lower_control_limit – an optional parameter which, when present, will override the internally calculated lower control limit; note that this is NOT the specification limit!
highlight_beyond_limits – True if points beyond limits are to be highlighted
max_points – the maximum number of points to display (‘None’ to display all)
figure – an instance of
matplotlib.figure.Figure
- Returns:
an instance of
matplotlib.figure.Figure
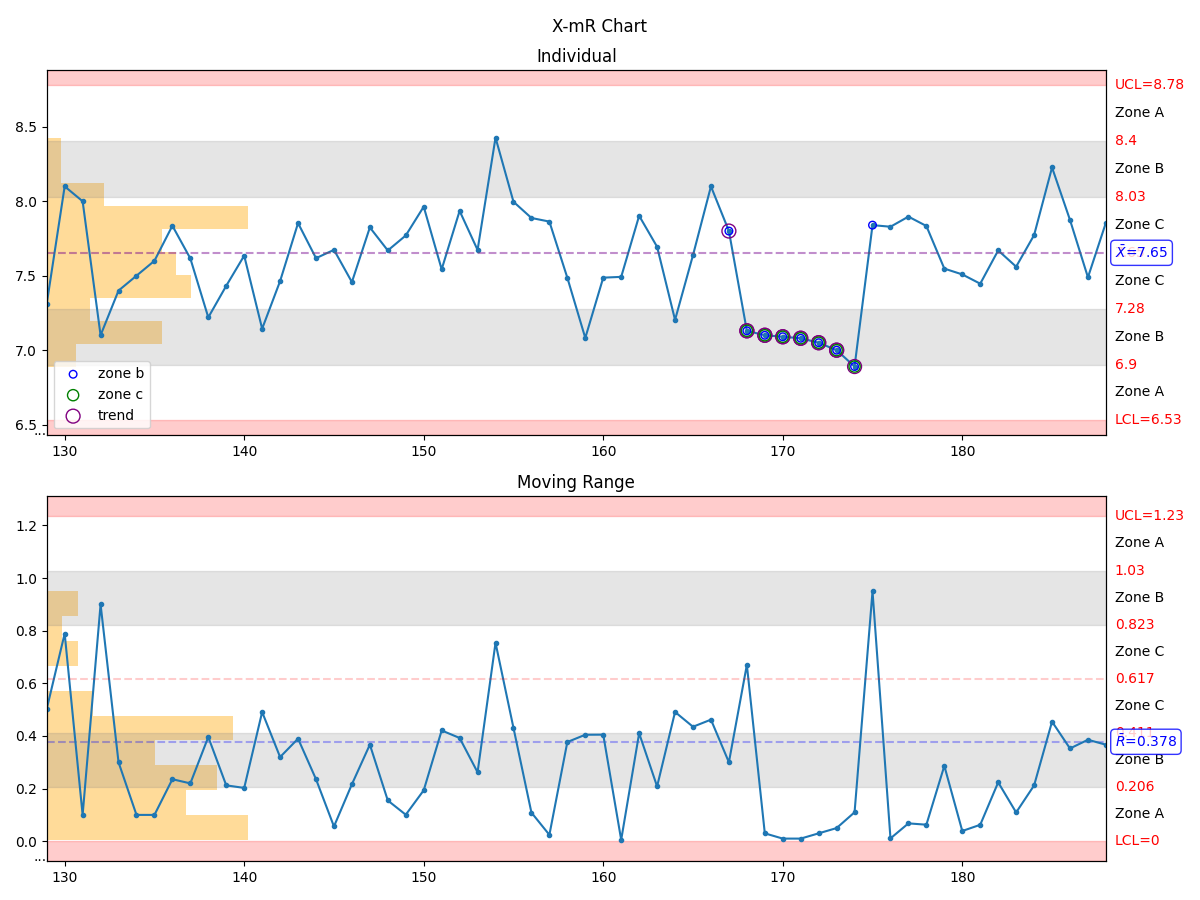
- manufacturing.x_mr_chart(data: list[int] | list[float] | Series | ndarray, parameter_name: str | None = None, x_upper_control_limit: float | int | None = None, x_lower_control_limit: float | int | None = None, mr_upper_control_limit: float | int | None = None, mr_lower_control_limit: float | int | None = None, highlight_beyond_limits: bool = True, highlight_zone_a: bool = True, highlight_zone_b: bool = True, highlight_zone_c: bool = True, highlight_trend: bool = True, highlight_mixture: bool = False, highlight_stratification: bool = False, highlight_overcontrol: bool = False, max_points: int | None = 60, figure: Figure | None = None) Figure
Create a \(X-mR\) control plot based on the input data.
- Parameters:
data – a list, pandas.Series, or numpy.ndarray representing the data set
parameter_name – a string representing the parameter name
x_upper_control_limit – an optional parameter which, when present, will override the internally calculated upper control limit for the X plot; note that this is NOT the specification limit!
x_lower_control_limit – an optional parameter which, when present, will override the internally calculated lower control limit for the X plot; note that this is NOT the specification limit!
mr_upper_control_limit – an optional parameter which, when present, will override the internally calculated upper control limit for the mR plot; note that this is NOT the specification limit!
mr_lower_control_limit – an optional parameter which, when present, will override the internally calculated lower control limitfor the mR plot; note that this is NOT the specification limit!
highlight_beyond_limits – True if points beyond limits are to be highlighted
highlight_zone_a – True if points that are zone A violations are to be highlighted
highlight_zone_b – True if points that are zone B violations are to be highlighted
highlight_zone_c – True if points that are zone C violations are to be highlighted
highlight_trend – True if points that are trend violations are to be highlighted
highlight_mixture – True if points that are mixture violations are to be highlighted
highlight_stratification – True if points that are stratification violations are to be highlighted
highlight_overcontrol – True if points that are overcontrol violations are to be hightlighted
max_points – the maximum number of points to display (‘None’ to display all)
figure – an instance of
matplotlib.figure.Figure
- Returns:
an instance of
matplotlib.figure.Figure
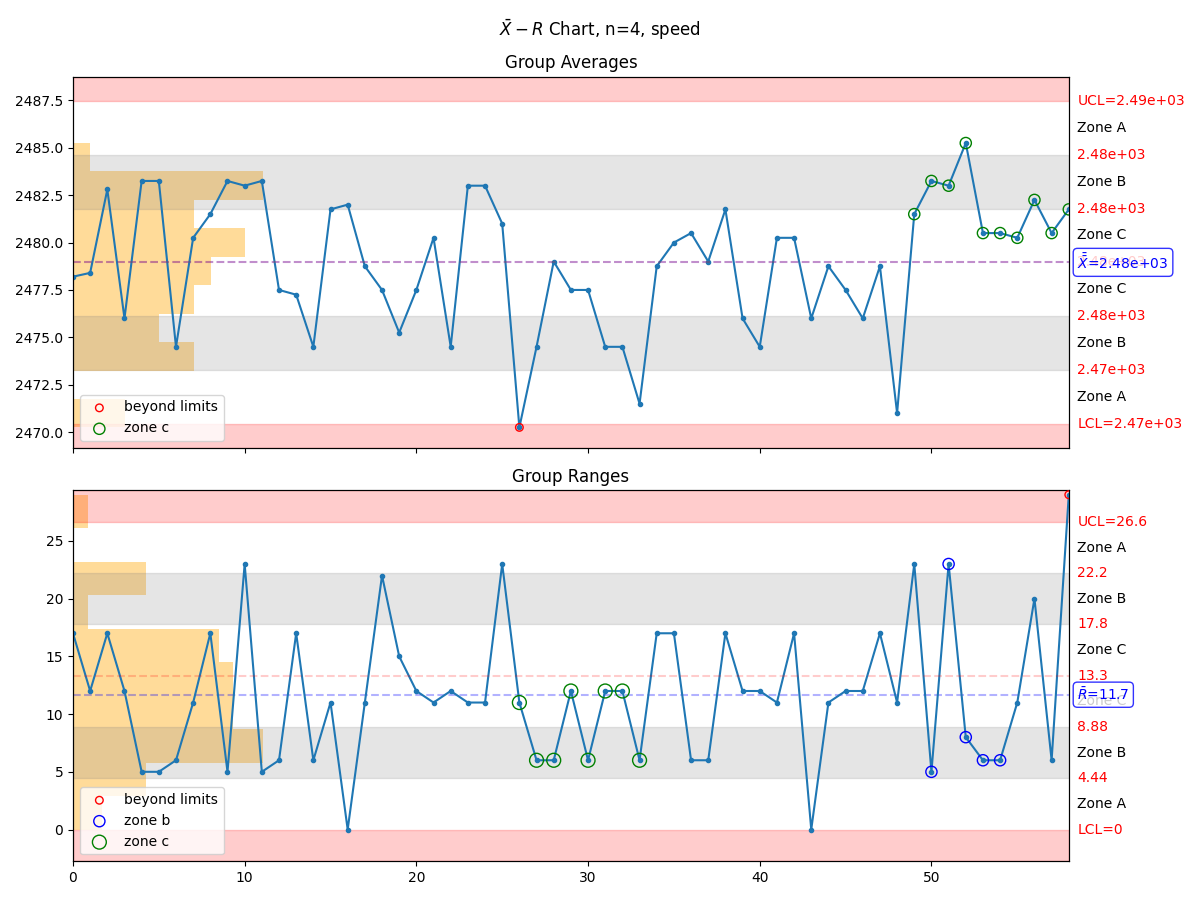
- manufacturing.xbar_r_chart(data: list[int] | list[float] | Series | ndarray, subgroup_size: int = 4, parameter_name: str | None = None, xbar_upper_control_limit: float | int | None = None, xbar_lower_control_limit: float | int | None = None, r_upper_control_limit: float | int | None = None, r_lower_control_limit: float | int | None = None, highlight_beyond_limits: bool = True, highlight_zone_a: bool = True, highlight_zone_b: bool = True, highlight_zone_c: bool = True, highlight_trend: bool = True, highlight_mixture: bool = False, highlight_stratification: bool = False, highlight_overcontrol: bool = False, max_points: int | None = 60, figure: Figure | None = None) Figure
Create a \(\bar{X}-R\) control plot based on the input data.
- Parameters:
data – a list, pandas.Series, or numpy.ndarray representing the data set
subgroup_size – an integer that determines the subgroup size (requires at least 3 subgroups)
parameter_name – a string representing the parameter name
xbar_upper_control_limit – an optional parameter which, when present, will override the internally calculated upper control limit for the X plot; note that this is NOT the specification limit!
xbar_lower_control_limit – an optional parameter which, when present, will override the internally calculated lower control limit for the X plot; note that this is NOT the specification limit!
r_upper_control_limit – an optional parameter which, when present, will override the internally calculated upper control limit for the R plot; note that this is NOT the specification limit!
r_lower_control_limit – an optional parameter which, when present, will override the internally calculated lower control limitfor the R plot; note that this is NOT the specification limit!
highlight_beyond_limits – True if points beyond limits are to be highlighted
highlight_zone_a – True if points that are zone A violations are to be highlighted
highlight_zone_b – True if points that are zone B violations are to be highlighted
highlight_zone_c – True if points that are zone C violations are to be highlighted
highlight_trend – True if points that are trend violations are to be highlighted
highlight_mixture – True if points that are mixture violations are to be highlighted
highlight_stratification – True if points that are stratification violations are to be highlighted
highlight_overcontrol – True if points that are overcontrol violations are to be hightlighted
max_points – the maximum number of points to display (‘None’ to display all)
figure – an instance of
matplotlib.figure.Figure
- Returns:
an instance of
matplotlib.figure.Figure
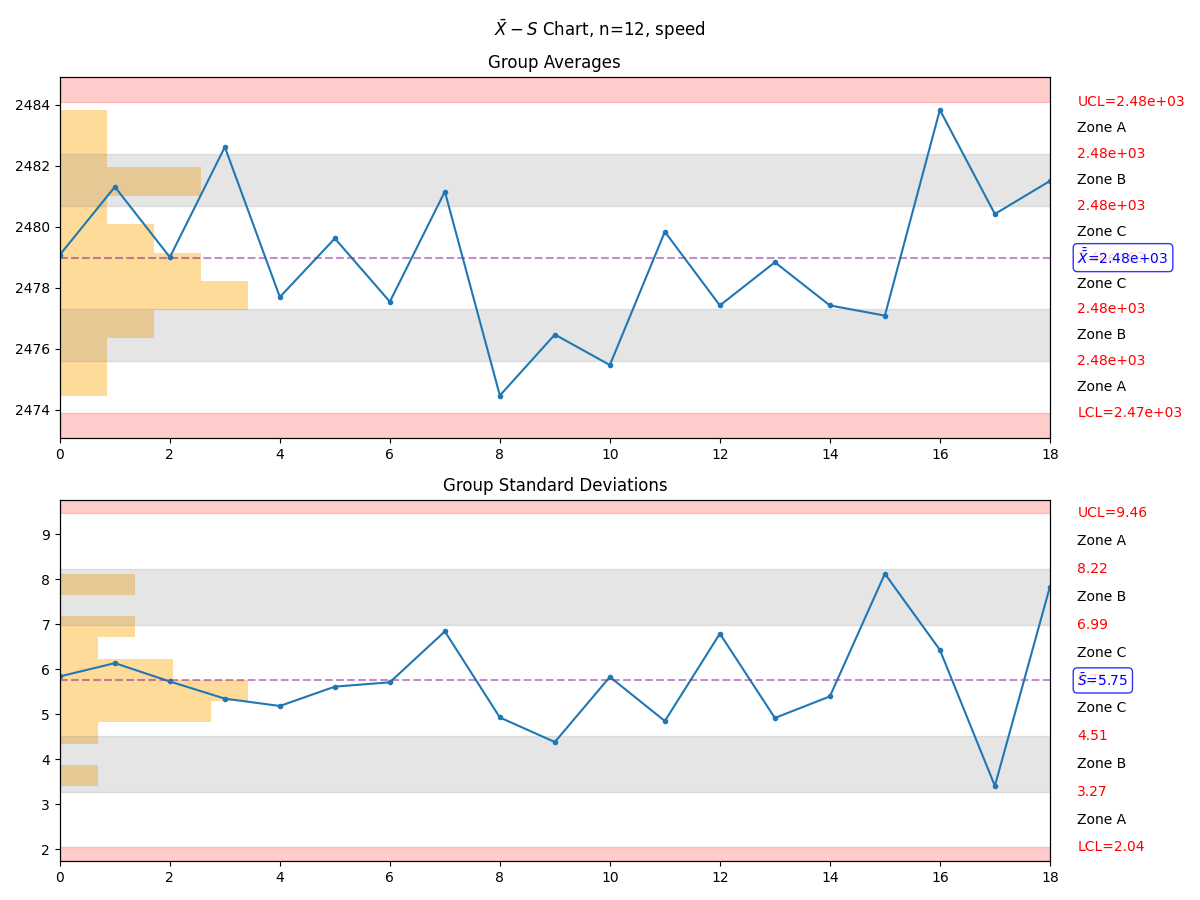
- manufacturing.xbar_s_chart(data: list[int] | list[float] | Series | ndarray, subgroup_size: int = 12, parameter_name: str | None = None, xbar_upper_control_limit: float | int | None = None, xbar_lower_control_limit: float | int | None = None, s_upper_control_limit: float | int | None = None, s_lower_control_limit: float | int | None = None, highlight_beyond_limits: bool = True, highlight_zone_a: bool = True, highlight_zone_b: bool = True, highlight_zone_c: bool = True, highlight_trend: bool = True, highlight_mixture: bool = False, highlight_stratification: bool = False, highlight_overcontrol: bool = False, max_points: int | None = 60, figure: Figure | None = None) Figure
Create a moving \(\bar{X}-S\) control plot based on the input data. Recommended for datasets which are to be grouped in subsets exceeding 11pcs each.
- Parameters:
data – a list, pandas.Series, or numpy.ndarray representing the data set
subgroup_size – an integer that determines the subgroup size
parameter_name – a string representing the parameter name
xbar_upper_control_limit – an optional parameter which, when present, will override the internally calculated upper control limit for the X plot; note that this is NOT the specification limit!
xbar_lower_control_limit – an optional parameter which, when present, will override the internally calculated lower control limit for the X plot; note that this is NOT the specification limit!
s_upper_control_limit – an optional parameter which, when present, will override the internally calculated upper control limit for the R plot; note that this is NOT the specification limit!
s_lower_control_limit – an optional parameter which, when present, will override the internally calculated lower control limitfor the R plot; note that this is NOT the specification limit!
highlight_beyond_limits – True if points beyond limits are to be highlighted
highlight_zone_a – True if points that are zone A violations are to be highlighted
highlight_zone_b – True if points that are zone B violations are to be highlighted
highlight_zone_c – True if points that are zone C violations are to be highlighted
highlight_trend – True if points that are trend violations are to be highlighted
highlight_mixture – True if points that are mixture violations are to be highlighted
highlight_stratification – True if points that are stratification violations are to be highlighted
highlight_overcontrol – True if points that are overcontrol violations are to be hightlighted
max_points – the maximum number of points to display (‘None’ to display all)
figure – an instance of
matplotlib.figure.Figure
- Returns:
an instance of
matplotlib.figure.Figure
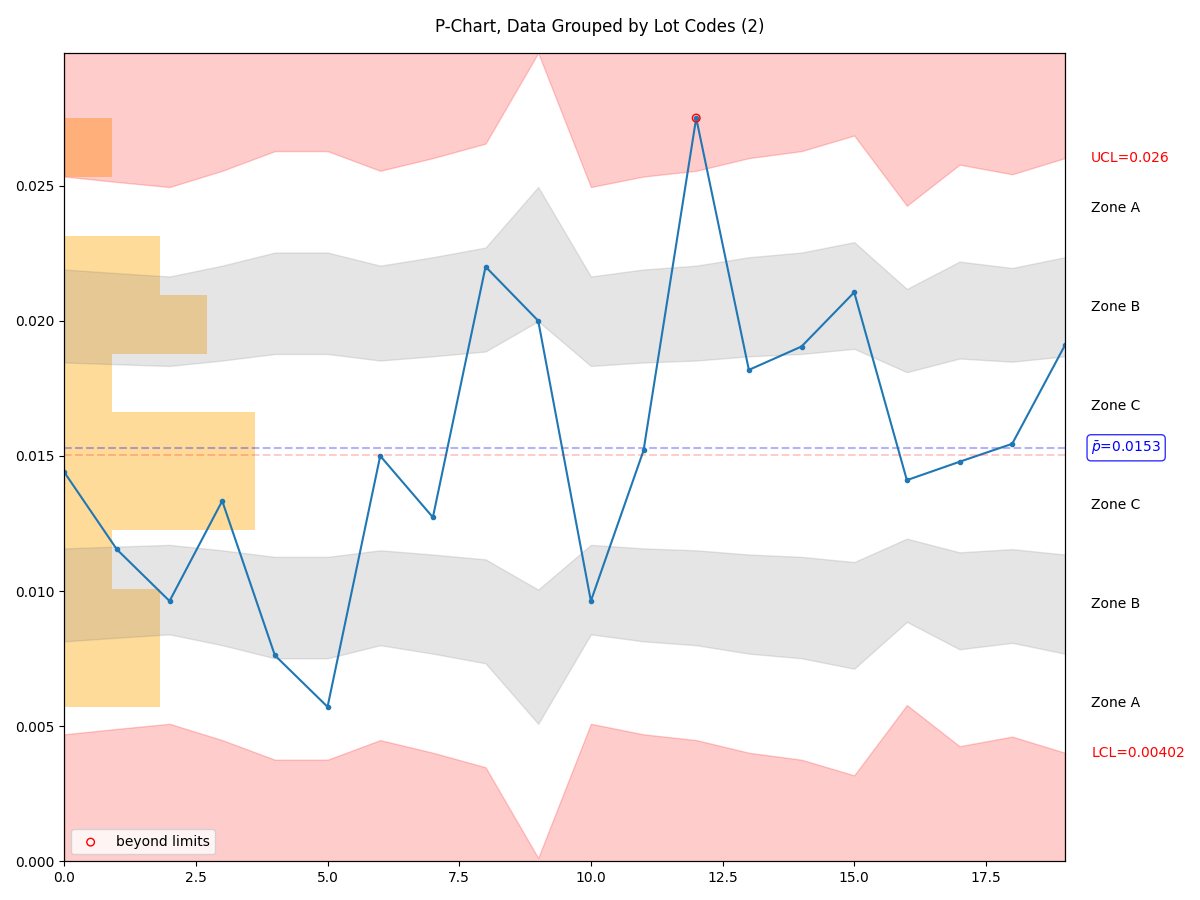
- manufacturing.p_chart(data: list[int] | list[float] | Series | ndarray, parameter_name: str | None = None, highlight_beyond_limits: bool = True, figure: Figure | None = None) Figure
Create a p-chart based on the provided data. The data must be a dataframe which contains the following columns:
pass, which contains a True/False or 1/0 indication of pass/fail status of a test sequence
lotid or datetime, either of which will be used to create subgroups; if lotid is provided, then data will be subgrouped into the defined lots; if datetime is provided, then lot sizes will be based on time units (hour, day, week, year) and will automatically be chosen to ensure that some defects are present in each lot size
Assumptions:
The probability of non-conformance is the same for each item
Each unit is independent of the other
The testing procedure is the same for each lot
- Parameters:
data – a dataframe containing two columns, pass and lotid or datetime
parameter_name – a string representing the parameter name
highlight_beyond_limits – True or False
figure – an instance of
matplotlib.figure.Figure
- Returns:
an instance of
matplotlib.figure.Figure
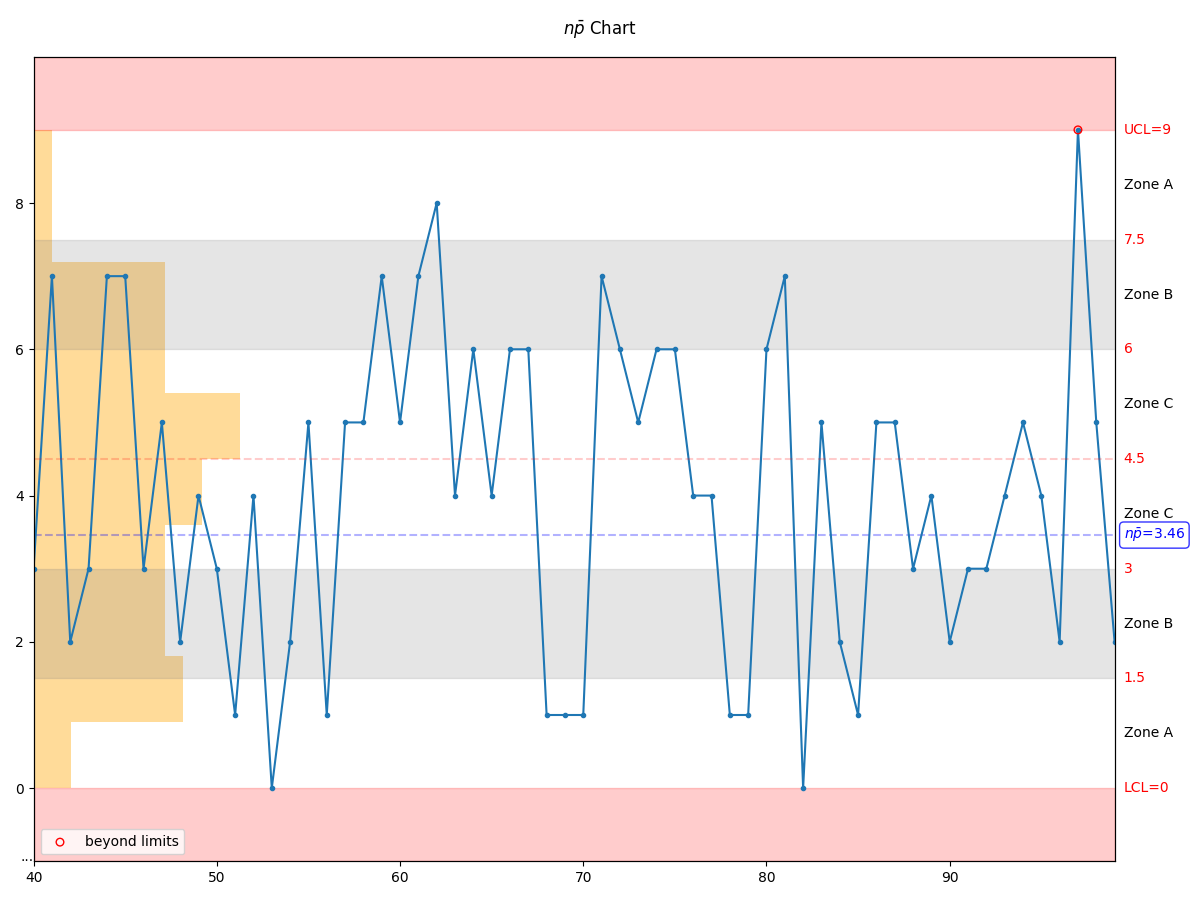
- manufacturing.np_chart(data: Series, num_of_lots: int = 100, parameter_name: str | None = None, highlight_beyond_limits: bool = True, figure: Figure | None = None) Figure
Create a np-chart based on the provided data.
Assumptions:
True represents conformance to specification and False represents non-conformance
The probability of non-conformance is the same for each item
Each unit is independent of the other (no duplicates!)
The testing procedure should be the same for each lot
- Parameters:
data – a list, pandas.Series, or numpy.ndarray representing the data set and consisting of only True/False values
num_of_lots – the number of lots into which to split the data; as this number goes up, the number of units in each lot will decrease
parameter_name – a string representing the parameter name
highlight_beyond_limits – True if points beyond limits are to be highlighted
figure – an instance of matplotlib.figure.Figure
- Returns:
an instance of matplotlib.figure.Figure
Import & Export
- manufacturing.import_csv(file_path: str | Path, columnname: str, **kwargs) dict | Series
Imports data from a csv file and outputs the specified column of data as a pandas.Series
- Parameters:
file_path – the path to the file on the local file system
columnname – the column name to which the data is associated
kwargs – keyword arguments to be passed directly into pandas.read_csv()
- Returns:
a
pandas.Seriesif no limits are embedded, otherwise a dict withdataand limits
- manufacturing.import_excel(file_path: str | Path, columnname: str, **kwargs) dict | Series
Imports data from an excel file and outputs the specified column of data as a pandas.Series
- Parameters:
file_path – the path to the file on the local file system
columnname – the column name to which the data is associated
kwargs – keyword arguments to be passed directly into pandas.read_excel()
- Returns:
a
pandas.Seriesif no limits are embedded, otherwise a dict withdataand limits
- manufacturing.data_import.parse_col_for_limits(columnname: str)
Return the upper and lower specification limits embedded into the column header.
Examples:
speed- just a column header called “speed”speed (lsl=10.4)- a column header with a lower specification limit built-in (no upper)speed (lsl=10.4 usl=15.1)- a column header with both lower and upper specification limits
- Parameters:
columnname – the column name to parse
- Returns:
2-value tuple of the form (lsl, usl); returns (None, None) if values not found